
Project
A weather station with homemade wind sensors
Building an ESP32 weather station, from printed wind sensors and C drivers to SD card logging and an MQTT dashboard.
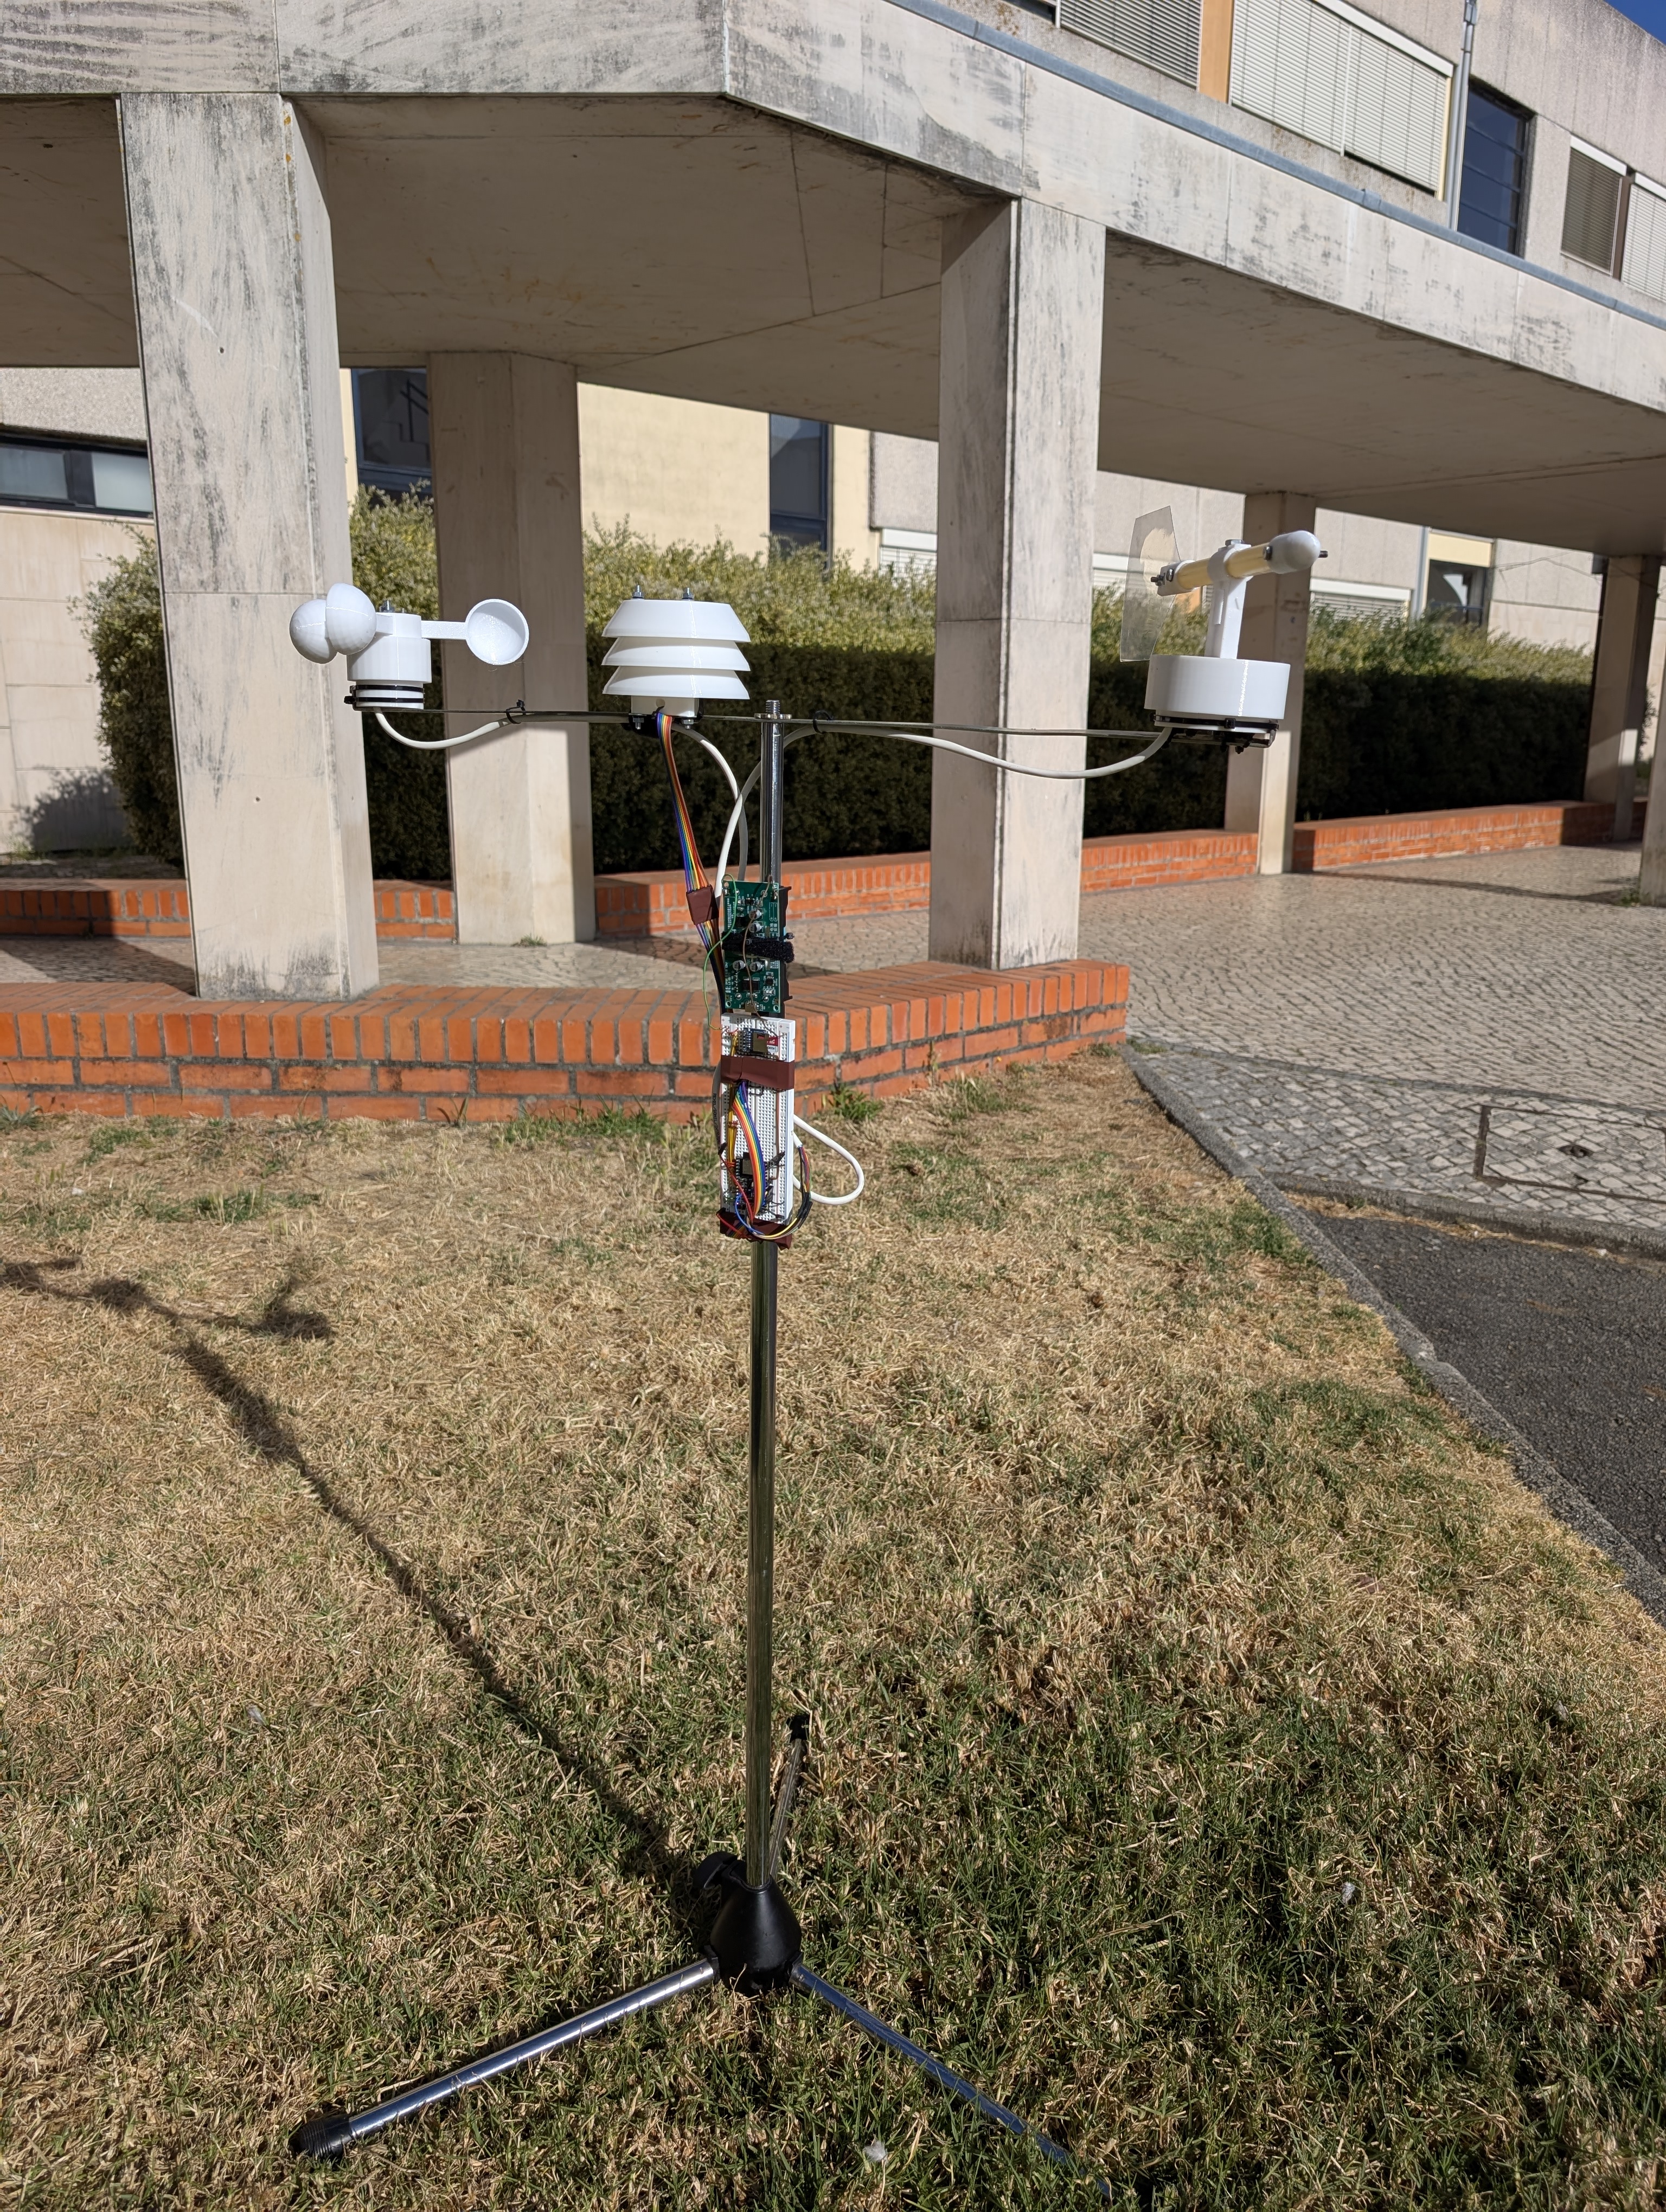
The wind sensors on this station are parts I designed and built. The cups, rotor, and vane use printed components; magnets and Hall-effect sensors turn their movement into signals an ESP32 can read. Together with a BME280, they give the station temperature, humidity, pressure, wind direction, and a wind-speed estimate.
I built it with Francisco Ribeiro in 2025 for Embedded Systems Architectures at the University of Aveiro. I planned and assembled the hardware, developed the wind sensors and their C drivers, and wrote the BME280 driver. Francisco handled Grafana, MQTT, Wi-Fi, and SD card integration. The photograph above shows the complete prototype during an outdoor demonstration.
Turning movement into a reading
The anemometer, WSP420, has three cups around a rotating hub, with magnets passing a Hall sensor as the rotor turns. The ESP32 counts rising GPIO edges in an interrupt handler. A FreeRTOS task opens a seven-second counting window, then converts the pulse rate into a speed estimate.
The calculation depends on a configured rotor radius and calibration factor. That last part matters: the code can count pulses, but the relationship between those pulses and wind speed also depends on the mechanics. Friction, cup geometry, and magnet placement all affect the result. The prototype uses an example calibration factor; checking it against a reference anemometer remains necessary before treating the values as accurate wind measurements.
The WVA420 wind vane uses the same sensing principle differently. Four Hall inputs correspond to north, east, south, and west. A single active input identifies a cardinal direction; two adjacent inputs identify the bearing between them. North and east together become north-east. This gives eight directions from four digital inputs, with Unknown returned when none is active. The assembly has to be physically aligned with north.
Writing the drivers
The BME280 supplies the three environmental measurements. I wrote its driver in C, including register access over I²C and SPI, chip identification, reset, configuration, and compensation using the sensor’s factory calibration coefficients. The assembled station uses I²C at 100 kHz.
A raw register value is only the start of a measurement. The driver unpacks temperature, pressure, and humidity from the device’s measurement registers, then applies the compensation equations. It also exposes choices such as oversampling, filtering, and operating mode. The application uses normal mode with 1× oversampling on all three channels.
The sensor work runs in three FreeRTOS tasks:
| Task | Approximate reporting interval |
|---|---|
| Temperature, humidity, and pressure | Every 2 seconds |
| Wind direction | Every 2 seconds |
| Wind speed | Every 10 seconds: 7 seconds counting, then a 3-second pause |
The wind-speed task yields during its counting window, so the other tasks continue running. The pause also means this version does not count wind pulses continuously.
Keeping readings on the station
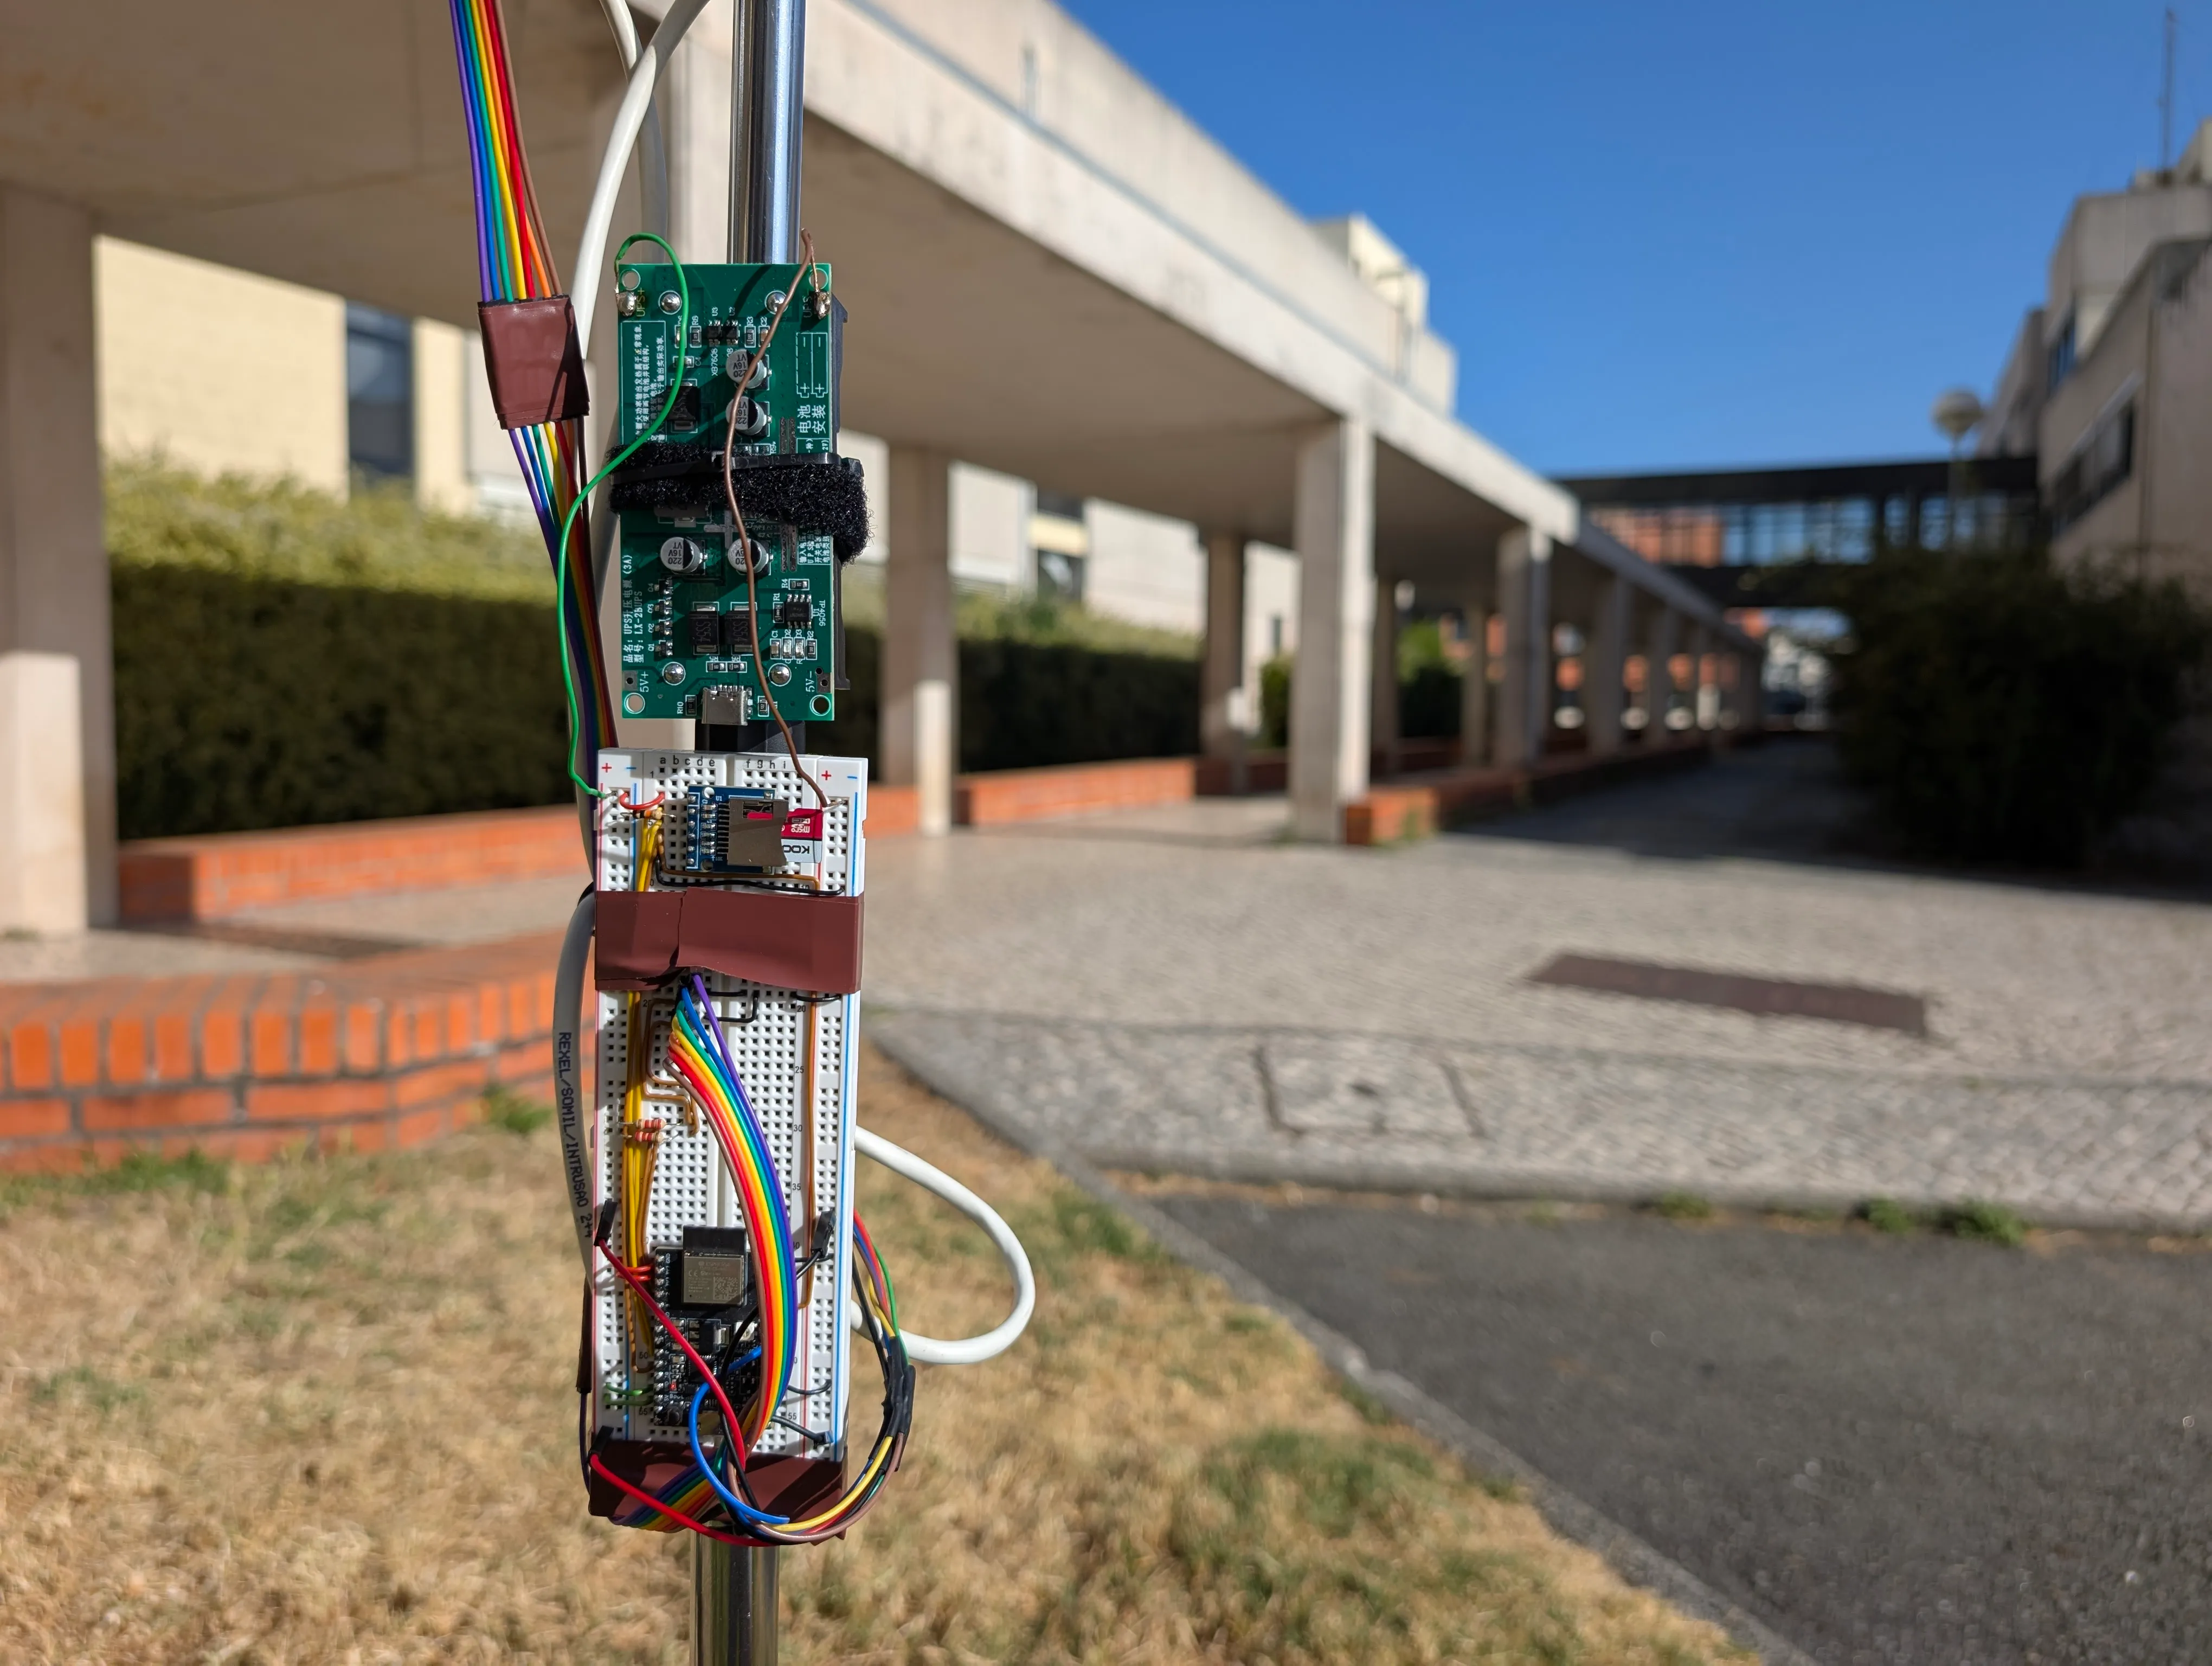
The controller and storage sit below the sensors. The battery UPS module is mounted above them.
The SD card holds both connection settings and measurements. Wi-Fi and MQTT settings are read at boot, so switching networks does not require a firmware rebuild. Once connected, the ESP32 attempts to synchronize its clock through SNTP.
Each successful sensor reading passes through a shared data handler. It adds a timestamp, attempts to append a CSV row, and then publishes a JSON message to MQTT. Separate topics carry the environmental readings, direction, and speed.
That gives the project a local record as well as a live feed. If MQTT disconnects after startup, readings still go through the SD logging path. The firmware does not replay those files when the connection returns; recovering missed measurements means retrieving them from the card. MQTT publication uses QoS 0.
Seeing the measurements
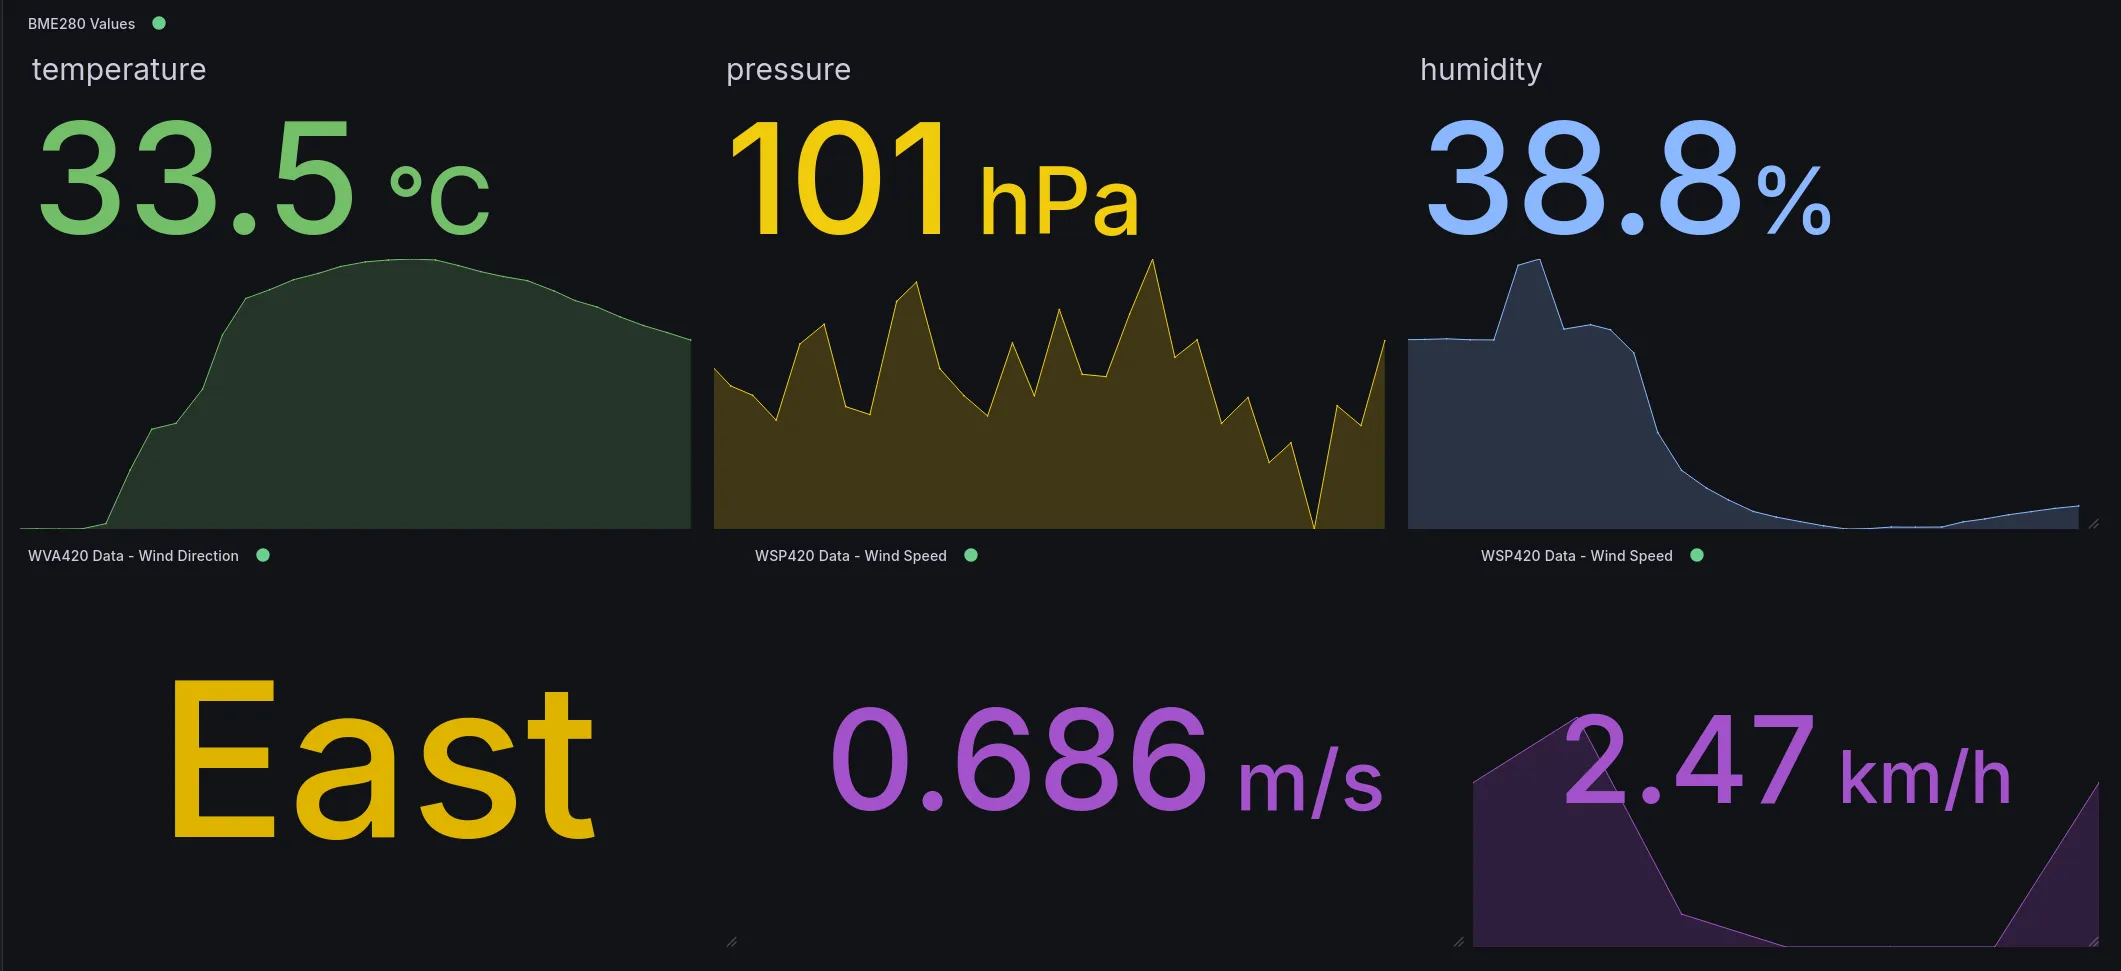
The original demonstration dashboard. Its pressure label is retained from the prototype; the firmware value is on the kPa scale, although the panel says hPa.
Grafana made it possible to watch the station respond during the demonstration. The dashboard brings the separate sensor streams together, while the firmware keeps the hardware drivers separate from data formatting, storage, and networking.
The photographs also make the prototype’s remaining work fairly obvious. The wiring needs a proper enclosure for longer outdoor use, and the wind sensors need mechanical refinement and calibration. The battery module is present, but the firmware does not yet monitor its charge or adjust sampling to save power.
Before a longer deployment, I would also correct the pressure units, address memory use in the data handler, and improve startup recovery when the MQTT broker is unavailable.
The source repository includes the firmware, wiring reference, original presentation, and setup instructions.